|
Details
|
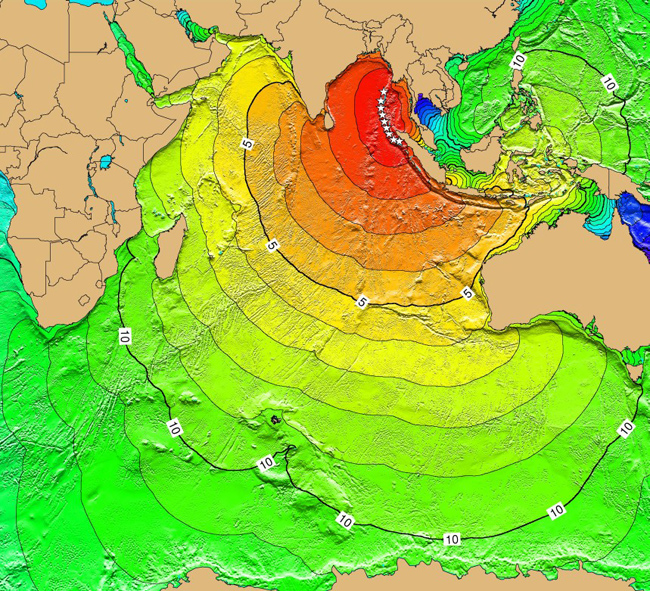
Indian Ocean Tsunami
|
Japan Tsunami
|
|
Date
|
26 December 2004
|
11 March 2011.
|
|
Cause
|
Earthquake 9.2 Mw
|
Earthquake 9.0 Mw
|
|
Wave size
|
15 to 30 metres on average but maximum over 50 metres
|
10 to 15 metres on average but maximum over 30 metres.
|
|
Warning
|
No warning system.
|
Warning system. 15 minutes warning given before the tsunami hit.
|
|
Defences
|
Some areas with seawalls, many without. Damage worse in areas without defences.
|
Seawalls along 40% of Japan's coastline. These are 10 metres high but the tsunami wave was higher.
|
|
Deaths
|
230,000–280,000 dead or missing (20% of the population of flooded areas). People were killed in 14 countries and the fatalities included citizens from 30 countries.
|
Over 18000 dead or missing (4% of the population of the flooded areas),
|
|
Other
|
650,000 were injured and over 2 million were made homeless.
|
26,992 injured. Over 340000 were made homeless. Huge destruction to homes, services, industries.
|
|
Response
|
The scale of the disaster made it difficult for emergency and rescue teams. The injured were untreated for days and people were without food and shelter. The United Nations Food Programme provided food for over a million people. Other countries sent over $ 14 billion in aid.
|
Emergency and rescue teams in place quickly. 100,000 soldiers helped. Charities, international medical and rescue teams assisted, e.g. over $ 1 billion received from charities.
|
|
Cost of damage.
|
$20 billion
|
$360 billion
|
|
Economic impact
|
Huge losses to the tourism, fishing and farming industries.
|
Huge losses to the fishing and farming industries. Also ports were closed for a time. Fukushima nuclear power station was damaged.
|
|
Environmental impact
|
Damage to mangrove swamps, coral reefs, beaches. Pollution - sewage, chemical. Salt water infiltrated soils.
|
Damage to coastal ecosystems. Pollution - sewage, chemical, nuclear. Salt water infiltrated soils
|
|
Long term response.
|
Reconstruction. A tsunami alert system has been established for the Indian Ocean. The tsunami hazard was also mapped and evacuation plans were created in many areas.
|
Reconstruction. Fukushima nuclear plant was closed. Emergency systems reviewed and improved.
|


